
Have you ever tied up your computer for hours with a vlookup? Or laboriously copy pasted rows of .csv data to the end of an Excel spreadsheet on a repeating report? If so, this post will save you more time than anything before! When you combine data using Python, you can improve your speed and accuracy.
Replace vlookups: combine data with pd.merge
Suppose you have an external vendor or consultant report in Excel or .csv format. Due to the report being new, your data engineers haven’t integrated it to the company database yet. Therefore, you can’t use SQL to join it to your internal performance data. How then do you create stories and reports combining the data? Previously, you may have pasted both data sets to Excel sheets and used vlookups.
However, vlookups can be time-consuming and cumbersome. For example, if you have over 100,000 rows of data, your vlookup might prevent you from running other tasks on your computer for an hour or more. In addition, the more columns you need from both data sources, the more vlookups you need to set up. In this situation, you can save a lot of time by reading both sets of data into a notebook and then joining them with pd.merge.
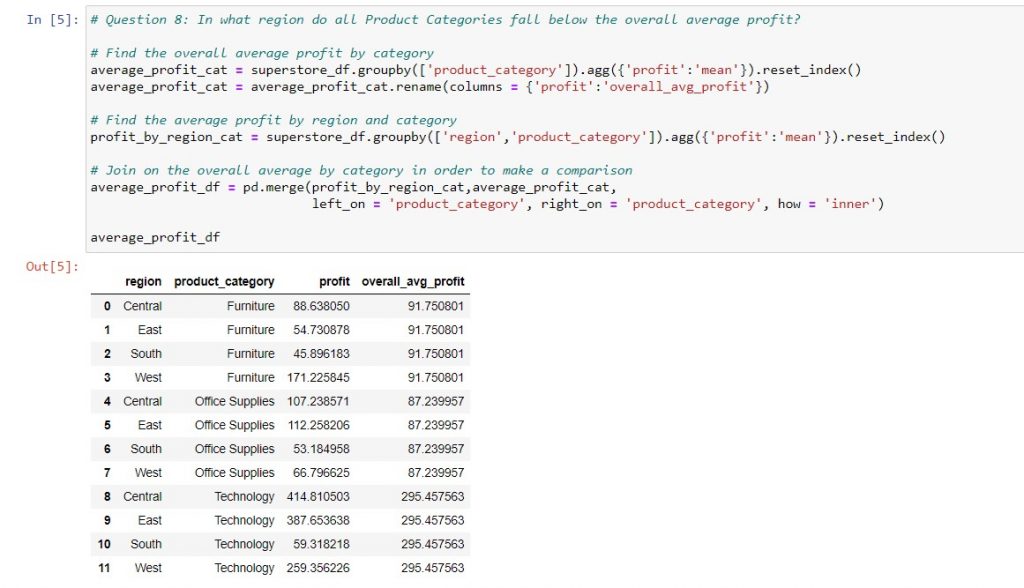
Syntax: merged_dataframe_name = pd.merge(dataframe_1, dataframe_2, left_on = ‘dataframe_1_column‘, right_on = ‘dataframe_2_column‘, how = ‘inner‘)
You’ll notice that pd.merge works similarly to joins in SQL. So, let’s break down the various keyword arguments:
- left_on: You’ll put the name(s) of the column, or list of columns, that you want to join from the first (left) DataFrame here.
- right_on: Similarly, you put the name(s) of the column or list of columns that you want to match to the left column(s) here, in the order that they match the left column(s). Similar to the SQL join, the name of the column(s) might not be the same in the left and right DataFrames. However, the values in the columns you are joining on must be able to match exactly in the left and right tables.
- how: This is where you put the type of join, i.e. ‘inner’, ‘left’, ‘right’, or ‘outer’. If you need a refresher on the different types of joins, you can find it here.
An example of using pd.merge to answer the Tableau Certified Associate Exam Guide sample question 8 is below:
What do you do if the values in your left and right columns don’t match?
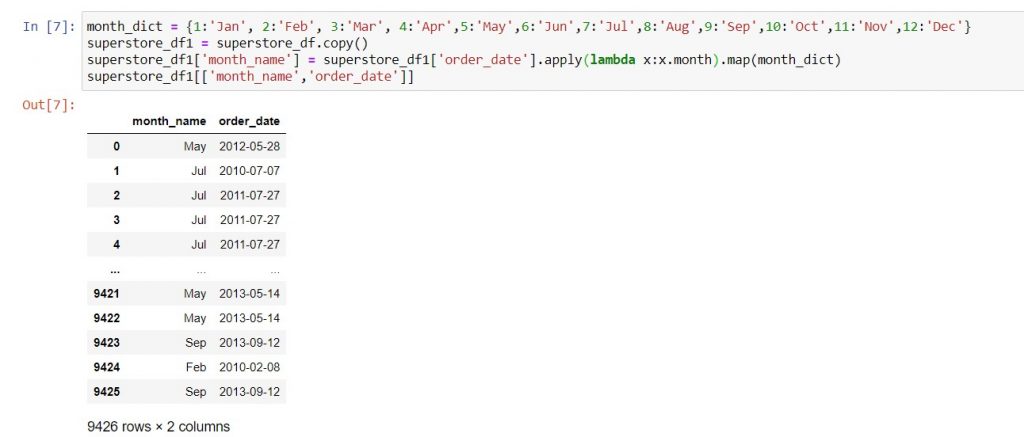
Especially when you are working with external reports, you may have to amend the values in order to match between the data sources. For example, one report may use month names (Jan, Feb, Mar…) and the other might use month numbers (1,2,3…). Or else, an external report might use product names, that you need to map to your internal product ID’s.
There are two ways you can achieve this:
- For a relatively short list, you can use a dictionary, e.g. {‘Jan’:1, ‘Feb’:2, ‘Mar’:3}. Then, you can map the column to its new values using the .map method. A refresher on Python dictionaries is here and the documentation for .map is here.
- For a longer list, you probably have the mappings in an Excel or .csv file. You can then read them into the notebook, and use pd.merge to merge in the new column with its values. To be safe, you’ll probably want to use a left or right join (depending on the order that you merge your data with the mapping data), in order to preserve all your original rows.
As a live example of method 1, let’s try mapping the order dates in superstore_df to their month names:
Combine data to update a report: use pd.concat
Now, let’s switch gears. Suppose you have an Excel report that you refresh daily / weekly / monthly. Every time you update, you have to copy paste a new set of data to the bottom of a spreadsheet, and use smart fill to extend any formulas that you’ve created to the latest data set.
How can you automate this in Python? First, you will write the formulas as functions, in the manner described here. Therefore, you can read your new data into the Jupyter notebook and apply all the functions to it to create the necessary calculated columns. At this point, I’m assuming that any previous data has already been read into the Jupyter notebook. So, you have two DataFrames and you can append the latest data to the historical data using pd.concat.
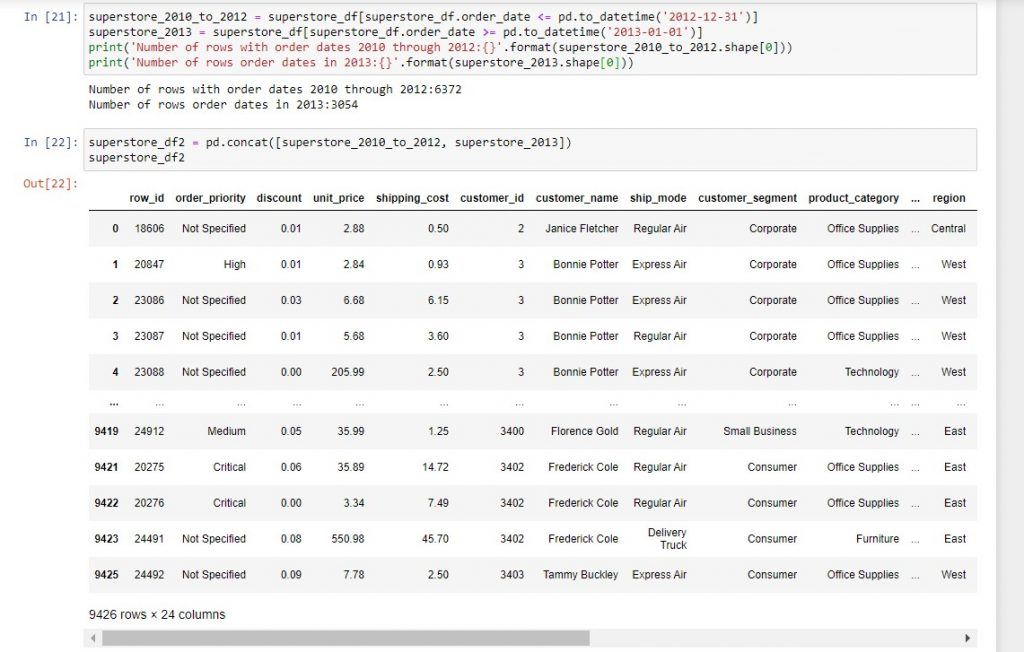
Syntax: new_dataframe_name = pd.concat([historical_data, new_data])
The most important thing to remember about the syntax is to pass the two dataframes into pd.concat as a list (i.e. within square brackets). To illustrate, we split the superstore DataFrame into orders before 2013 (6,372 orders) and orders during 2013 (3,054 orders) and then concatenated the two to get back our 9,426 original rows of data.
In this post, we’ve covered:
| Things you would do in Excel | Equivalent task in Jupyter notebooks |
| Use vlookups to combine data from two different sources row by row. | Use pd.merge to join the two data sets, similar to how you would join them in SQL. |
| Map values in a particular data set to different values with vlookups (usually to facilitate row-by-row comparison with a separate data set). | You can either read the mapping into your Jupyter notebook as a DataFrame and then use pd.merge, or map the data using a Python dictionary. |
| Copy paste new data to an existing data set and extend formulas for calculated columns using smart fill. | Apply the functions to create the calculated columns to the new data, then append it to the bottom of the old data using pd.concat. |
Technical references
| Functions or methods | Official pandas documentation |
| pd.merge | This page gives you the full range of keyword arguments you can use with pd.merge. In particular, you can also set the indexes of the two tables to the columns that you want to join, then use left_index = True, right_index = True to perform the merge. Information on how to set the index in a DataFrame is here. |
| pd.concat | The official documentation is here. One notable keyword argument is ignore_index = True, which allows you to re-number all the rows of the new DataFrame in sequence. |
| .map | See here – you can map not only to a dictionary, but also a function. |