
Businesses like to know what their top-performing products, markets, and segments are. Therefore, you’ll need to sort and rank data quite often. Usually, you would do this in Excel, but you can do it more quickly with pandas.
Sort data within a DataFrame
For example, in this post we split the superstore data into 2 parts: orders from 2010 to 2012, and orders in 2013. Then, we put the data back together again by concatenating the two parts. How do we check whether the rebuilt DataFrame (superstore_df2) is the same as the original one (superstore_df)?
Firstly, we need to ensure that the rows in both DataFrame follow the same order. This is important because we need Python to match every value in the corresponding rows and columns to check if they’re the same. Hence, we use sort_values to establish our sort order. In this example, I will sort by order date, then by ship date, and then by row ID.
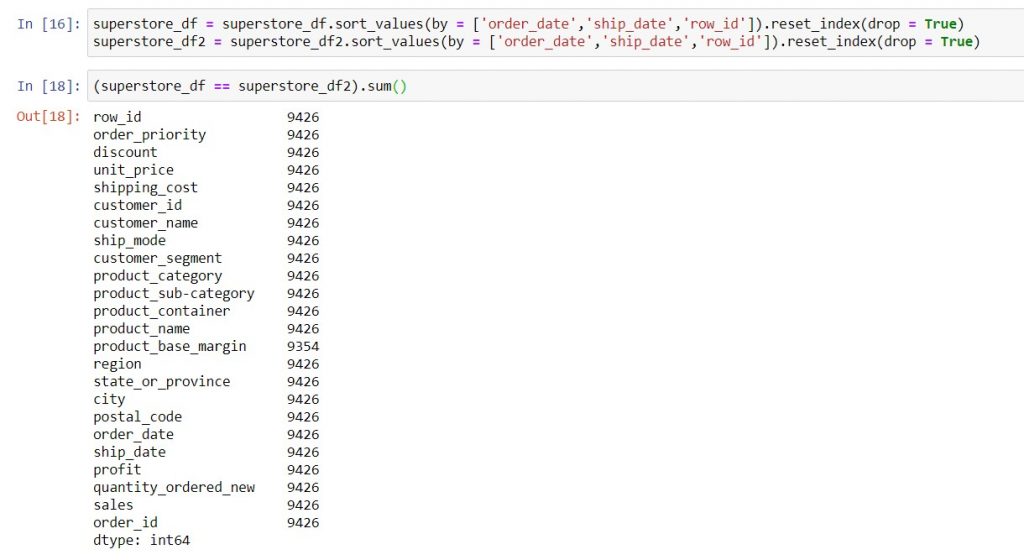
Syntax: dataframe_name = dataframe_name.sort_values (by = [‘column_name‘], ascending = False).reset_index(drop = True)
- by: Give this keyword argument the list of columns that you want to sort, in the order that you want to sort them. If you use Excel’s Custom Sort, here’s an easy way to remember. Excel sorts your columns in the sequence you name them from top to bottom. Similarly, your list of columns will be sorted from left to right in sort_values.
- ascending: The default sort order is ascending. So, if you want to sort in descending order (e.g. products with the highest sales), you must specify ascending = False. When you sort multiple columns, you can use a list of True or False values to sort your columns differently.
- reset_index: This sets your index (row numbers) to run sequentially in the new order of your data. The keyword argument drop = True removes your old index (vs. creating another column with it).
Rank data: Find top performers
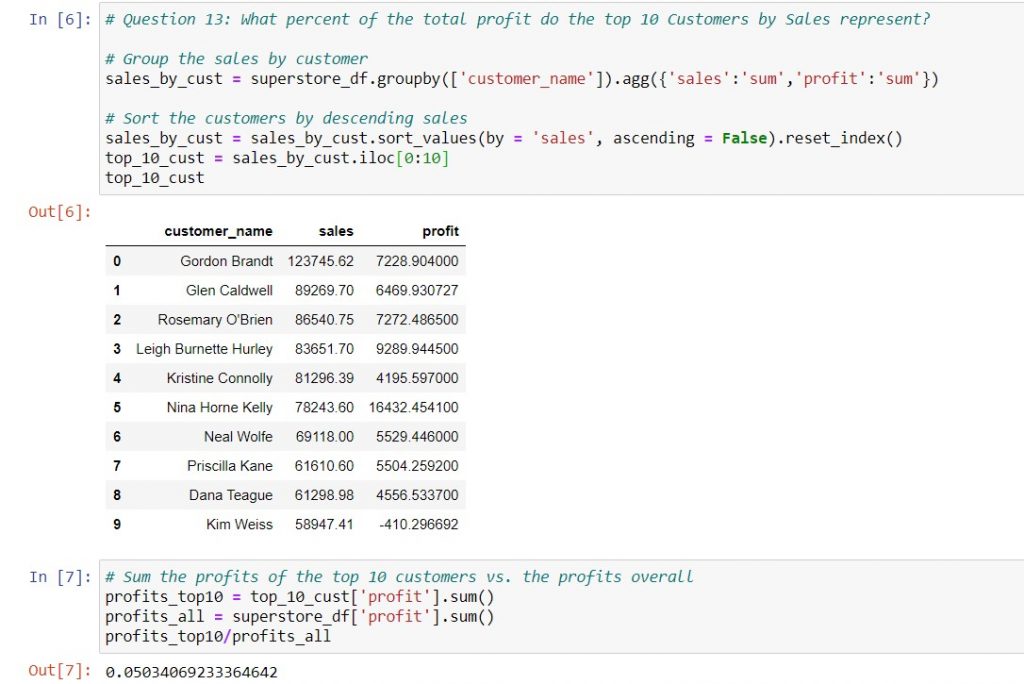
Let’s use the example from the Tableau Certified Desktop Associate exam guide sample question 13. Here, it asks us to identify the top 10 customers by sales, then find the percentage of total profits they cover. For this purpose, I’ll focus on ways to identify the top 10 customers by sales.
First, you can use .groupby to group your sales and profit data by customer. A detailed explanation on how to group data in pandas is here. Next, you can sort the customers by descending sales, using sort_values. Third, when you reset the index, the index values will represent the rank of the customer, minus one. This is because Python starts counting with 0, instead of 1. Finally, you can pull out the top 10 rows of the sorted data, using iloc. When doing this, do remember that Python starts counting from 0, and to end at the desired index plus 1. Thankfully, because Python starts at 0, you will always end at the number of top performers you want to pull, i.e. top 5 ends at 5, top 10 ends at 10, etc.
However, what happens if we need to rank performers within different sub-categories? For example, in question 5 of the exam guide, we need to find the top 10 product names by sales in each region. In this case, we need to use .rank to let pandas assign the rank for us.
Syntax: dataframe_name[‘rank‘] = dataframe_name.groupby([‘group_column_name‘]).[‘metric_column_name‘].rank(ascending = False)
- First, the .rank method will create a new column with the ranks, so remember to give that column a name.
- Second, group the DataFrame on the sub-category that you want to rank by. In this case, that would be the region. This ensures that each new region will be ranked separately. So far, the syntax follows what we had done in previous usage of .groupby.
- Third, put the name of the column that you want to rank on within square brackets. This is one of the syntaxes we could use with .groupby.
- Fourth and finally, use the .rank method, specifying ascending = False if you need to rank from largest down. This will often be the case if you’re looking at top volume drivers. However, if you don’t put anything in the round brackets, pandas will automatically rank in ascending order.
In this post, we’ve covered:
| Things you would do in Excel | Equivalent task in Jupyter notebooks |
| Sort data using the “Custom Sort” functionality | Use sort_values to sort a DataFrame on one or more columns. |
| Find top performers within sub-categories by sorting on multiple columns (sub-category, then the metric you want to rank by) and then creating a custom formula to get the ranks | Use .groupby and .rank to rank your data within sub-categories, and then filter the output for the required number of top performers. |
Technical references
The pandas official documentation for sort_values is here and for .rank is here. We also used iloc to slice a DataFrame after sorting (documented here) and .isin to filter a DataFrame for values within a given list (documented here).