When looking at business data, time is always an important factor. From the start, you will focus on pulling your metrics over a relevant (and likely to be recent) time period. Next, you will drill down into trends over time, and compare performance over similar past periods. As a result, you will spend considerable time working with date and time data in pandas.
Converting dates into pandas DateTime format
Firstly, you need to check whether the dates you’re working with are already in. Especially when you are importing a .csv file, you cannot take this for granted. For example, the US COVID-19 case surveillance report has 3 date columns: CDC report date, the positive test date, and the symptom onset date. However, when Pandas initially reads the file, it reads these 3 columns as text.

Syntax: dataframe_name.dtypes
The data types of the columns in a DataFrame (abbreviated to dtypes) is one of the attributes of a DataFrame (see here). When you need to check whether your data is stored in the right way, you can use this code to print out the column names and their data types. Typically, you will see 4 common data types:
- object – for text
- int64 – for whole numbers without decimals
- float64 – for numbers with decimal points
- datetime64 – for dates
Here, you want to convert all the dates from text into datetime64. As a result, you need to use the pd.to_datetime() function.
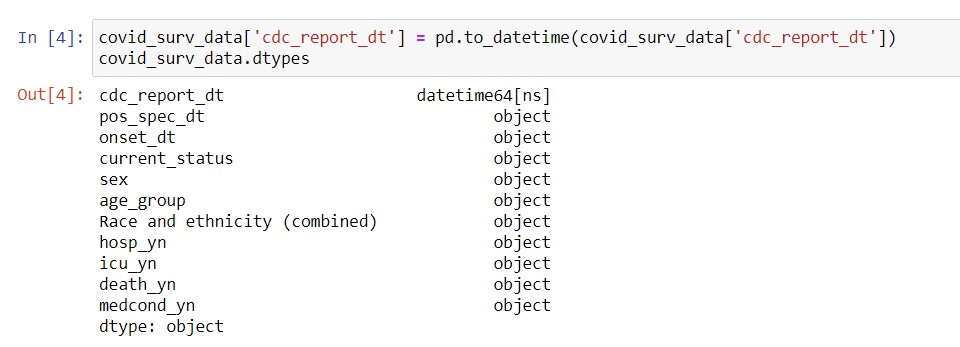
Syntax: dataframe_name[‘column_name‘] = pd.to_datetime(dataframename[‘column_name‘])
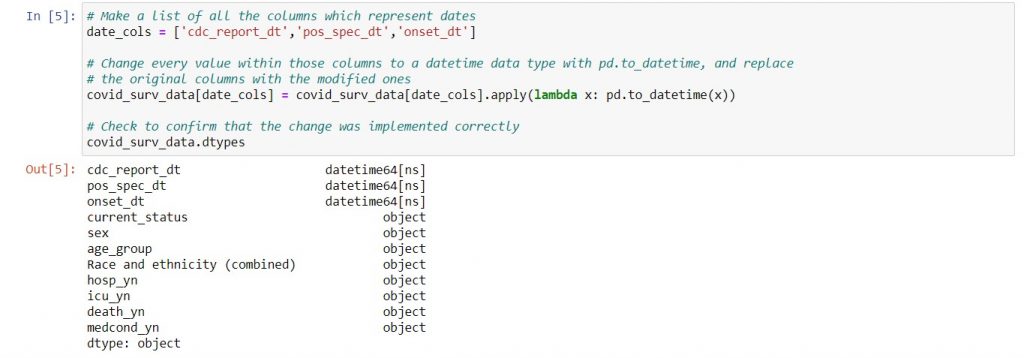
And because this is Pandas for Productivity, I’ll show you how to convert multiple columns to datetime at once. For now, each step has an explanation in the comments; scroll down to the “Technical References” section for a walk-through on lambda notation. Alternatively, you can download the code here where I’ve written this as a function for you to re-use.
Working with date and time parts
If you recall, we discussed date parts in Survival SQL. At the time, I suggested that you could pull date parts that interest you directly into your SQL aggregation. While this is a useful approach when you’re doing a monthly or quarterly performance summary, sometimes you are looking at daily data, and then also want to roll it up to a weekly / monthly / quarterly view. In such cases, you’ll save time by grouping the data by date in SQL, then extracting the additional date parts in pandas later.
Date parts are attributes of a Pandas DateTimeIndex object (i.e. a column of datetime64 values). In fact, you can break down dates into many granular levels, right down to the nanosecond (full list is here). However, let’s summarize the attributes which are most useful for business performance assessment:
| Use case | Useful datetime attributes |
| Grouping performance into different time periods and comparing year-over-year seasonal performance | .year .month .quarter .dayofyear |
| For businesses with significant differences in weekday vs. weekend trends | .dayofweek (Monday = 0, Sunday = 6) |
| Comparing performance by hour of day, especially for online businesses who want to know at what time their customers are most active | .hour |
When you extract a date part from a datetime column, you can also use lambda notation. For example, let’s go back to the superstore example. If we want to extract the year and month of the order, we can do this:
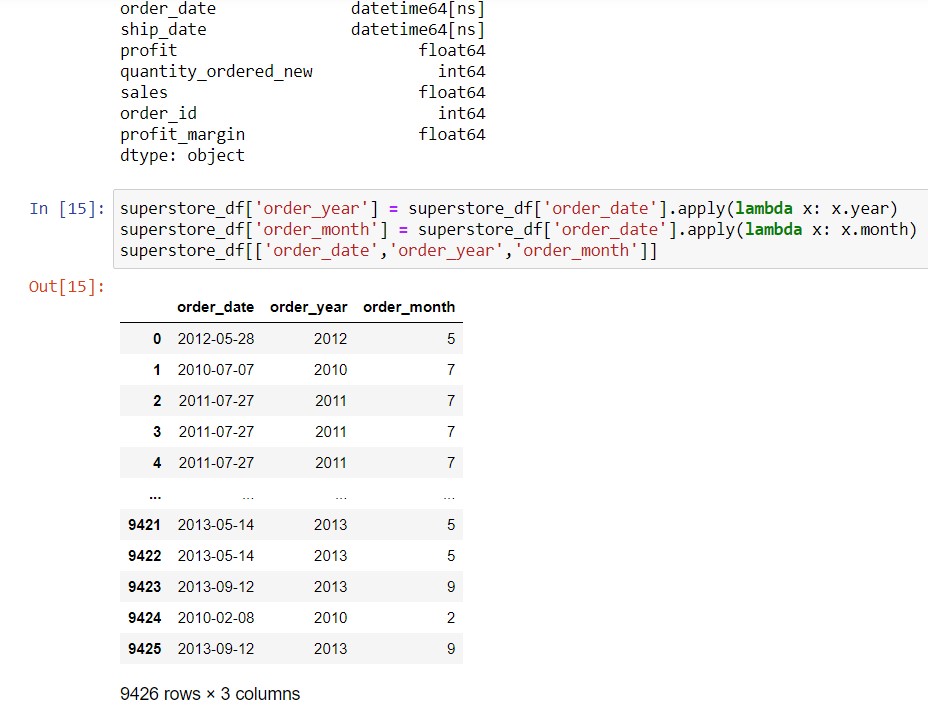
Syntax: dataframe_name[‘new_column_name‘] = dataframe_name[‘date_column_name‘].apply( lambda x: x.date_attribute_name)
First of all, we confirmed that the order_date column is already in datetime64 format, using .dtypes. You can see the output of that right at the top of the image. Next, we extracted the year and month attributes of each value in the order_date column, creating 2 new columns.
An even quicker way to group daily data into bigger time periods is to use .resample. We will cover that in a future post on how to group data. However, extracting the year and month, then grouping by month and year, is the quickest way to manipulate your daily data for plotting year-over-year comparisons by month. This also works well for doing the same thing with quarters.
Calculating time differences, also known as TimeDeltas
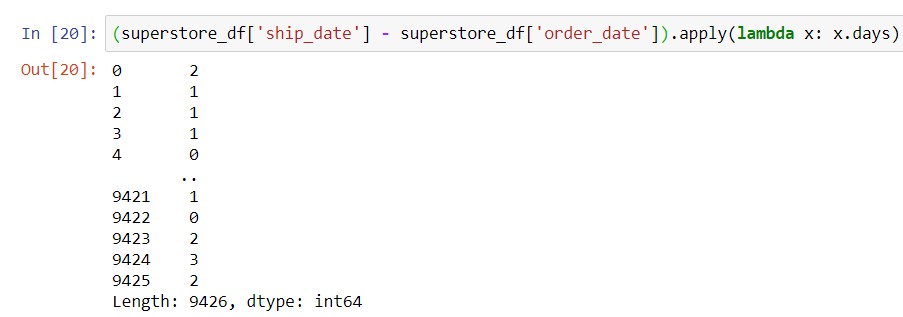
Suppose we want to know how many days it usually takes to ship a product after an order is placed. From this post we know that we can do arithmetic on DataFrame columns, so we can subtract the order date from the ship date like this:
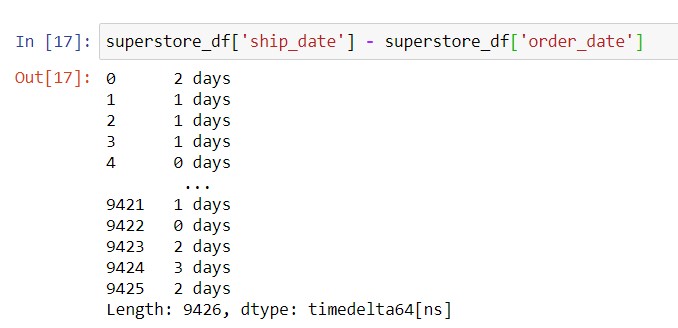
You will notice that the data type for the time difference is called timedelta64. Hence, you need to know the attributes of a TimeDelta object in order to work with these values, and can find the information here. For business applications, you normally will work with the .days attribute to get time differences in days.
Syntax: dataframe_name[‘date_difference_column_name‘] = (dataframe_name[‘later_date_column_name‘] – dataframe_name[‘earlier_date_column_name‘]).apply(lambda x: x.days)
So, to apply conditions based on the number of days between order and ship date, you can convert the time delta into the number of days (which is an integer) like this:
Adding or subtracting time periods to a date
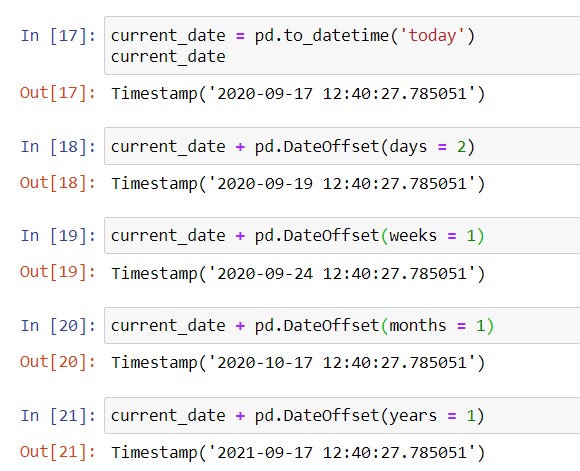
Sometimes, you want to add or subtract time periods to a particular date. To this purpose, pandas allows you to create DateOffset objects, which represent a time difference that you can add or subtract to a date. Here are examples where we add different date offsets to today’s date:
Typically, a business’s seasonality depends both on the day of week and the time of year. Here is a function that maps a date in any past year to its day-of-week match in the current year:

Again, this is part of the notebook of sample functions that I’ve posted to GitHub here.
In this post, we’ve covered:
| Things you would do in Excel | Equivalent task with Jupyter notebooks |
| Format a given column as a date | Use pd.to_datetime to convert dates stored as text into date format |
| Get date parts from a date using MONTH(), YEAR() functions etc. | Get date parts from a date (DateTime object in pandas) using its attributes, e.g. .month, .year etc. |
| Find the number of days between two date columns by subtracting one from another or using the DAYS() function | Subtract one date column from another using the – operator, then convert the TimeDelta to days by extracting the .days attribute. |
| Add or subtract days to a given date column. | Add or subtract different time periods (days, weeks, months, years) to a date using pd.DateOffset |
Technical references
I’ve already placed the Pandas technical documentation links into the relevant parts of this post. Because dates and time periods have so many different groupings that can be useful, I wanted you to see all your options at a glance. Therefore, this section will focus on two other areas: lambda notation, and creating date strings.
Explaining lambda notation
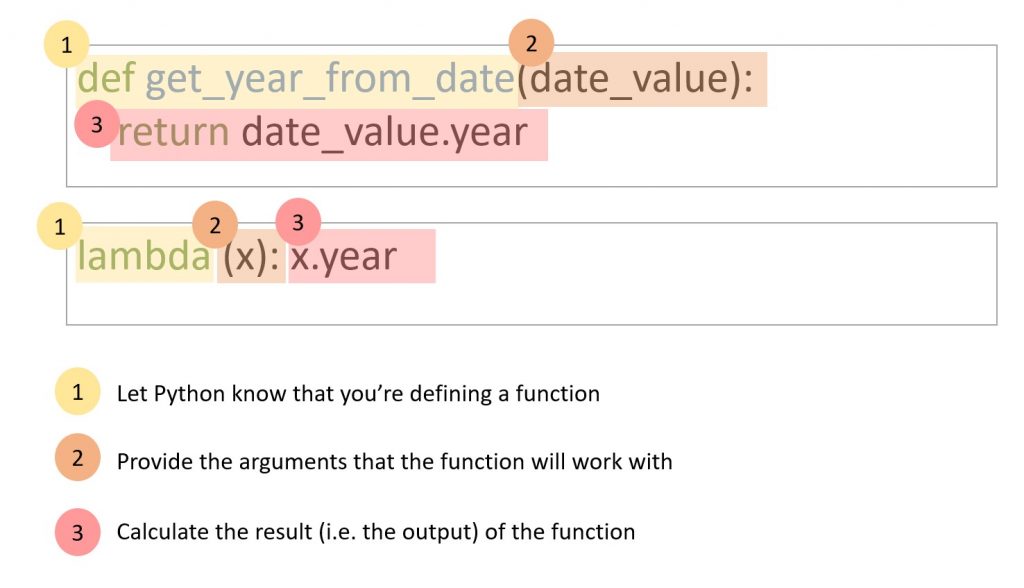
Think of lambda as a short way to write a function. We explored the structure of function definitions here, and we do need that long format to write functions that we will use (call) repeatedly in the rest of our code. However, when doing something to a column of data, we’re actually executing code many times. Let’s say we have a column of 1,000 dates, and want to extract the year of each date. This means that we’re grabbing the year attribute of the date 1,000 times!
Hence, we have to define a function to grab the year of a date, and then apply that function to every date in the code. With lambda, we don’t have to spend time giving this function a name, and then typing that name again every time we call it. Therefore, we can write a function in a much shorter way. Below is a diagram showing how to turn a function definition into lambda notation:
You can also refer to the Python documentation here (scroll down to 4.7.6 “Lambda Expressions”), and some further explanations here.
How to get date parts in strings (e.g. ‘mmm’ or ‘mm-yyyy’ or ‘mm-dd’)
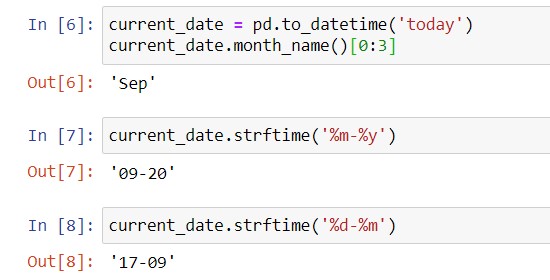
Sometimes, you want to get human-friendly ways of expressing dates, in order to save time when you create your final charts. For example, you might want to pull the month name of the date. To achieve this, you can use the .month_name() method, documented here.
Next, you might want to pull the first 3 letters of the month i.e. Jan, Feb, Mar etc. Since the month name is a string, you’ll do this by pulling out the first 3 letters of the string, i.e. [0:3], which is called “slicing”. You can read more about strings and string slicing in Python For Everybody here. In short, you interpret the slicing syntax as follows:
- Enclose the slice in square brackets.
- Start with the index that you want the slice to begin. Remember, Python starts counting at 0 so 0 denotes the first letter of the string.
- End with the index that is one after the one where you want the slice to end. So, the first 3 letters of the month name correspond to indices 0, 1 and 2, and you will end at 2+1 = 3.
- Separate the starting and ending indices of the slice with a colon.
To get month-day and year-month combinations, you can use the .strftime() method, documented here. Some examples of pulling the month name, mm-dd and yy-mm date parts from today’s date are below:
You can combine all of these using lambda expressions to get the format that you want.
