Earlier, we’ve discussed that your database stores data at its most granular level. This means that every order creates one row in your orders table. Likewise, every click a customer makes creates one row in your clicks table. And every review you receive creates one row in your product reviews table. When this builds up over a few years, these tables will end up with several million rows each! That’s when you need to group (aggregate) the business metrics you pull from these tables. Aggregating metrics reduces the number of data rows. This makes your report more manageable and easier to understand.
This Kaggle notebook contains all the code you need to follow along with the examples. Run cells 1 and 2, then go straight to cells 7-9 (Chapter 4).
Aggregating metrics over time periods: The most common use case
Let’s imagine the number of orders your company gets in a day. Suppose you have 10,000 orders on average. That translates to more than 3.5 million orders per year! In your database, your company might store information on the exact date and time that every order was made. But when you talk to your management about business performance, you won’t be looking at every individual order. Instead, you’ll present a broader trend about order volumes by month or by quarter.
To create a monthly report, you will need to aggregate the order-date information in your database by month. Your orders table should contain a date column, which captures the date and time of each order. Now you have to roll up these dates and times to the month that they belong to.
Dates and date parts
Dates contain many components that could all be interesting for analysis. For example, if you’re in a seasonal business like adventure sports, the month or even the week of year could be interesting. Because financial reports are quarterly, almost every company will want a view of business metrics by quarter. Perhaps you’re in a retail or leisure business that thrives on the weekends. In that case, looking at business performance by the day of week could be important for you.
All of the above date characteristics are called “date parts” in SQL. While all versions of SQL have functions to extract date parts from a date or timestamp, the syntax is slightly different by version. (Note: A timestamp is a date and time with accuracy to the second. It also reflects a particular time zone for that time.) So if your company has a date dimension table in its database, your easiest option is to join your data to that table. That way, you don’t have to remember many functions to pull different date parts because your engineers have done all that work for you!
But what if you don’t have a date dimension table? Don’t worry – you can get by with remembering a few date functions:
- Pulling a specific date part — functions like month(), year(), quarter()
- Why this is useful: To track performance by a specific time period or by seasonality of your business.
- Getting the difference between two dates — functions like datediff()
- Why this is useful: Some business characteristics are measured by time spans e.g. shipping or delivery time, the length of a hotel stay, etc.
Date functions in different query languages
The syntax that I provided for the above functions is for Hive. Here are the relevant functions in different versions of SQL. You can click on the version name to go directly to the documentation.
| Version | Date part extraction | Date difference |
| Hive Click on the link above to access documentation | day(), month(), quarter(), year(), weekofyear() | datediff() |
| Presto Click on the link above to access documentation | date_trunc() | date_diff() |
| Microsoft SQL Server | day(), month(), year() Documentation here | datediff() Documentation here |
| MySQL Click on the link above to access documentation | day(), month(), quarter(), year(), dayofweek(), weekofyear() | datediff() |
| IBM DB2 | day(), month(), quarter(), year(), dayofweek(), week() Click on each function above to access its documentation. | days_between() Documentation here |
Aggregating (grouping) metrics by date parts
You’ve extracted the date parts you need from your table. Now, you need to think about how you measure your metric in relation to the grouping that you’ve created.
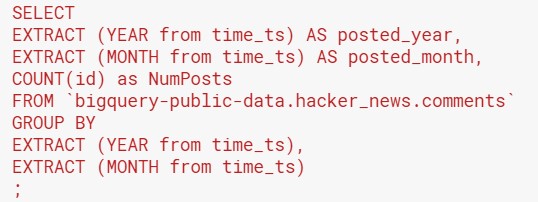
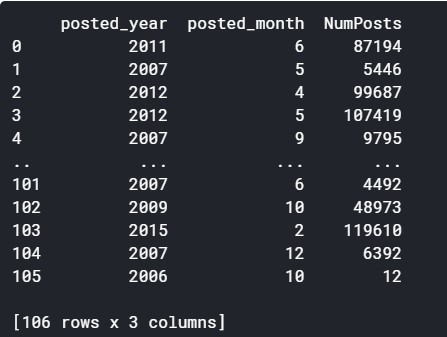
Many times, one row in a table might represent an event that you’re trying to track. In this example from Google BigQuery public data, each row in the “comments” table represents a comment in Hacker News. Therefore, I need to count the number of comment ID’s to get the number of comments made in a given year and month. My code looks like this:
You will notice that the date functions used to obtain the year and month look very different from the ones in my table above. But don’t worry about this – Google BigQuery has its own date function formats. So as long as you’re not working with BigQuery data, you don’t have to learn these functions. You will only need to know the date functions for the SQL version that you work with.
The output from the query looks like this:
Syntax notes for aggregations and “GROUP BY”
- The “GROUP BY” syntax requires you to create the columns that you want to group your data with.
- If the column is already in a table in your “FROM” clause, you can just name the column.
- But if you need to get the value by using a function (e.g. extracting a date part from a date), you need to write that function and give the column a name using “AS” (see sample code above).
- For every column that you create to group the data by, you need to repeat that column name or formula in the “GROUP BY” clause at the bottom of your code.
- For all metrics that need to be calculated according to your groupings, you need a function to tell SQL how to calculate this number. This is called an aggregate function.
- Also, to ensure that you understand your output, you need to assign a name for the calculated column using “AS” (see sample code above).
- Be careful with when you need a comma! You will need one except in the last lines before “FROM” and before the end of your query.
Types of aggregate functions
Most often, you will use either SUM() or COUNT() to aggregate your data. Let’s say your table has a total number in each row that you need to add up, e.g. the total revenue from a given order. This is when you use SUM(). However, if you are counting the number of rows to track how many times an event happened, you will use COUNT(). That would be a scenario like the example above.
Older versions of SQL have five aggregate functions: SUM(), COUNT(), AVG(), MIN() and MAX(). However, with the advent of data science, Hive, Presto and DB2 all have a wider range of aggregate functions. Typically, these cover different types of descriptive statistics that you want to know about your data (e.g. variance, standard deviation, percentiles, etc).
- Hive aggregate functions are here
- Presto aggregate functions are here
- DB2 aggregate functions are here
Key action items and take-aways:
- Take stock of all the date groupings of interest to your business, and learn the functions or joins to pull out these groupings from your fact table.
- Look at all the metrics that you use in your business reports. Consider the tables that they come from (get sample queries from your analytics or business intelligence team to do this).
- For each metric, should it be aggregated using SUM(), COUNT(), or AVG()? You can answer this question by thinking about what each row represents in the table where you’re pulling the metric from.