
As you become confident with pulling data, you’ll start wanting more control over the metrics you report on. Hence, you’ll want to define your own metrics. Therefore, you’ll want to learn how to use operators and conditional statements.
This Kaggle notebook contains all the code you need to follow along with the examples. Run cells 1 and 2, then go straight to cells 10-13 (Chapter 5).
Define your own calculated metrics: Mathematical operators
Firstly, math operators are similar to how they appear in Excel. Most often, you will use +, -, *, and /. Next, you might want to round your results, using the round() function. This is achieved by typing ROUND(value, decimal places) in your query.
To illustrate, we can work with BigQuery’s Chicago Taxi Trips data set. In this dataset, there are the length, duration, time, taxi ID, location, and amount paid per trip, with each row in the table containing one trip. These are the columns in the table:

As a start, some of the payments don’t go to the taxi company, e.g. tolls. Furthermore, the trip total adds up to more than the fare + tips + tolls + extras. Hence, we want to calculate the taxi company revenue, which consists of fares and tips only. Additionally, we will build a metric of trip total per mile, rounded to 2 decimal places. The code looks like this:
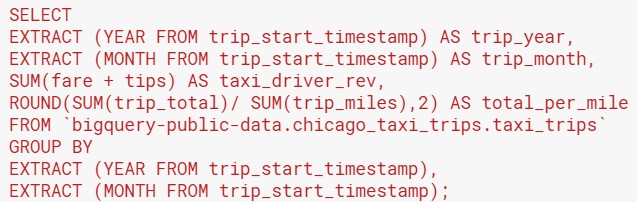
- Be careful about the order in which operations are made.
- For example, the fare and tips are summed for every trip, then summed again for all trips in the year-month.
- However, for the total paid per mile, each trip consists of multiple miles. You want the average to be weighted by the number of miles traveled, not by the number of trips. Therefore, you have to sum the total paid and then divide it by the sum of miles traveled, instead of calculating trip_total / trip_miles for every trip.
- Aliasing is your friend here! SQL will not generate user-friendly names for columns in the output created by calculations. So, you have to assign your own descriptive names.
Define your own categories using CASE WHEN
Secondly, you may wish to define your own categories for a specific slant to your business story. To this end, you can use a “CASE WHEN” statement, also known as a conditional expression.
Suppose we want to look at taxi fares and tips depending on the trip duration. For instance, we can classify trips that are shorter than 5 minutes (300 seconds) as “short”, and longer than 15 minutes (900 seconds) as “long”. Our question is: do customers pay a higher percentage of tips on short or long trips? To answer this question, the code looks like this:
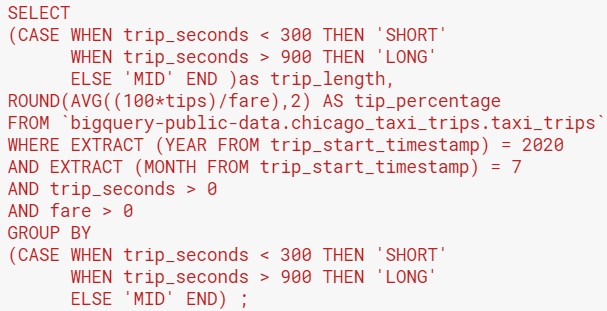
- Note the structure of a CASE WHEN statement: CASE WHEN – THEN – WHEN – THEN … ELSE – END.
- When you group data by a category created with a CASE WHEN statement, you have to repeat the entire statement in the GROUP BY clause.
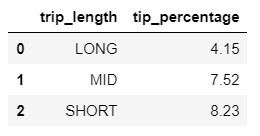
If you’re interested in the answer to the question we posed, here’s the query output. It shows that longer trips attracted a lower percentage of tips to fares.
Long / short / mid query: Interesting points to note
These points are not related to the CASE WHEN syntax, so I’ve created a separate section for them:
- I aggregated the tip percentage using AVG(tips / fare), instead of SUM(tips) / SUM(fare). This tells SQL to divide the tips by the fare on every row of data (every trip). Then, it will average the tips / fare per trip for all the trips. This will create a simple average, whereas SUM(tips) / SUM (fare) will be biased towards the trips with higher fares (a weighted average).
- Operators and functions can be used within filters, too! In this case, I used the date functions to extract the year and month of trips that I was interested in.
- Take care to pull only the data that you need, by making your “WHERE” clause as specific as possible. In that way, SQL runs faster and you are not overwhelmed by a big and complex file. This table is huge, so I had to pull data for a specific time period to stay within my data size quota.
- Consider the scenarios where your data won’t make sense. In this example, I pulled only the trips where the trip time and trip fare were greater than zero. This is because a zero trip time or fare is likely to result from a data mistake, that renders my metrics meaningless.
Key actions and take-aways:
- Examine the queries behind the dashboards that you use the most in your daily work. Do you work with calculated metrics?
- For each calculated metric that you use often, examine the order in which operators and aggregation functions are used. Do you agree with the logic? If you don’t understand why calculations were performed in a particular order or disagree with how the formula was written, have a conversation with your analytics or business intelligence team.
- When you need to do a new custom analysis, think about the new calculations or “CASE WHEN” logic that you need to create. You can brainstorm the syntax with your analytics or business intelligence colleagues.