
“Find our 5 best-selling products by country.””What was the 7-day moving average revenue for every day last month?” Chances are, you’ve come across one of these business questions before. And previously, you’ve probably solved them either by creating a ticket for your analytics team, or by writing manual formulas in Excel. Instead of doing these calculations in Excel, you can use SQL window functions. With window functions (also known as analytic functions) in your SQL toolkit, you can answer these questions in minutes instead of hours.
This Kaggle notebook contains all the code that you need to follow along with the examples. Run cells 1 and 2, then go straight to cells 24 – 29 (Chapter 8).
Top performers question: RANK() window functions
Let’s go back to the Openaq data set. If you recall, there are 98 countries in the data, and the table contains the pollution metrics at city level. Suppose we want to find the top 3 most polluting cities in every country. We would need to sort the cities by pollution level, then rank them in descending order for every country. If we did this manually by country for 98 countries, it would take hours! Thankfully, SQL can do it for us in a matter of minutes.
The example below shows how you would write this query. There are 2 new concepts here, as illustrated in the visual:
These are the key things to note about the RANK() window function syntax:
- Nothing needs to go into the brackets for RANK(). You will specify what to rank on in ORDER BY later on.
- After the word OVER, you have another set of brackets that define the window which RANK() computes on. This is where you need to specify 2 things:
- PARTITION BY — This is where you state the categories that need to be ranked separately. For example, if you are ranking best-selling products by country, you would partition by the country.
- ORDER BY — This gives the logic that SQL will rank on. So in this case, it is ranking on descending pollution value, such that top polluters come first.
After you get your ranked data, you may wish to filter it within the SQL query. This way, you can get the number of top performers you need without filtering your data again in Excel. For minimal risk of error, you’ll want to write your RANK() query first, then turn it into a sub-query after testing it and inspecting the results. After that, you can write a filter for the maximum rank to pull, using the “WHERE” clause on the sub-query. It is easier for me to “show” than to “tell” you how to do this, so just compare your query structure with the sample above!
Ranked output: Strange things you might see
Here’s the output from the query above. You might have expected to see exactly 3 cities per country, but there are exceptions. The diagram below explains what happened with the 2 types of exceptions.
In the Israel example, if you want to get the city that came next after the three #2’s, use DENSE_RANK() instead of RANK(). Everything else in the syntax stays the same. This site has a concise and illustrative explanation of the difference between RANK() and DENSE_RANK().
If you want to break ties, the window function alone cannot do that for you. You could use another column to break the ties. This works in the same way that adding columns to sort by in Excel does. However, here’s where your business judgement comes in, as some rankings might not make sense for your story. Here’s an example of how we could break the tie for Israel:
Aggregation window functions: Moving average
You can build a window function on any aggregation function in SQL. This becomes useful when you need to calculate moving totals or moving averages. Here, I will zoom in on the moving average because it’s the most common scenario in a business context.
For this example, we will use the COVID-19 open data in Google BigQuery. This data set gives us the COVID-19 daily cases, hospitalizations, deaths, etc by country and city. As a start, we will pull the daily new cases in Italy since 1 August:
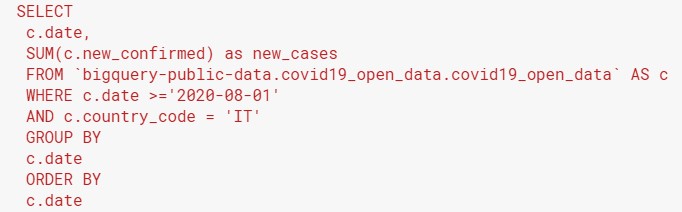
By now, you should be familiar with the structure of this query. It uses the SUM() aggregation function to add up all the new cases for each city in Italy on a given day. You will get 2 columns of output: the date, and the new cases for that day in all of Italy.
After building and testing the first query, let’s make it into a subquery. Next, we will calculate the moving average. The window function is in the black box on the revised query below:
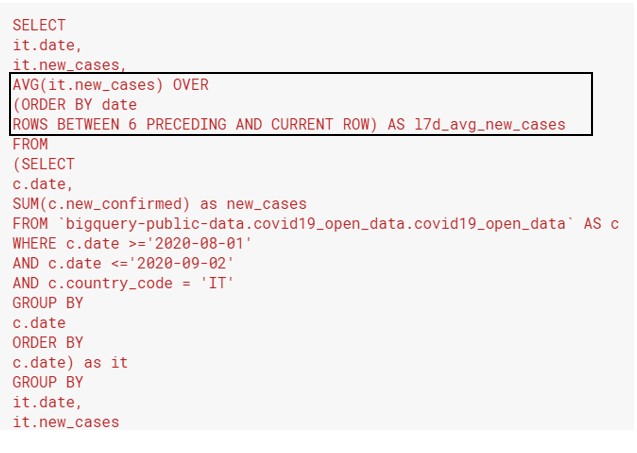
These are the key things to note when calculating moving averages with window functions:
- The brackets with AVG() have to contain the name of a column in the table that you’re querying from. This is how you tell SQL what to average.
- ORDER BY — Be careful about the sequence (ascending or descending). For dates, you normally order them in an ascending way. This makes it easy to plot a time series graph from left to right. Also, it’s intuitive to grab the preceding rows as the dates immediately before your current date.
- ROWS BETWEEN [number] PRECEDING AND CURRENT ROW — This is how you tell SQL how many days to calculate the moving average over. For this to work properly, you need to note 2 things:
- Each row in your underlying data has to represent one date.
- You must use ORDER BY to sort your dates in a consecutive way.
- The current row (current date) is one of the dates that you are averaging over! That is why you are using 6 preceding and not 7 preceding rows to start your calculation. 6 preceding + your current row gives you 7 days.
- You can run this query on multiple countries, using PARTITION BY in the window to tell SQL to calculate the moving average on different countries separately.
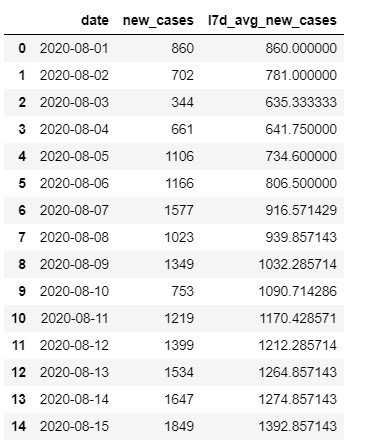
Moving averages: Sample output
The output from the query above looks like this. You will see that for every date that did not have 7 days of previous history, SQL will take the average of the previous days that were there. E.g. Aug 2nd will have the average of the new cases on the 1st and 2nd, Aug 3rd the average of the 1st, 2nd and 3rd, etc. Then from Aug 7th onward, you will have a full 7-day moving average.
Types of aggregate window functions available in SQL
Moving averages are the most common moving aggregation that you’ll need for business. Above this, SQL can also support window functions on the same aggregation functions that you use with GROUP BY. Namely, these are COUNT(), SUM(), AVG(), MIN(), and MAX(). Most versions of SQL have more window functions than just these, but many of them are more relevant to statisticians or developers than to business users. The syntax for using any of these 5 aggregate functions as a window function is similar to the moving average example from above.
SQL books with in-depth coverage of window functions
After you get used to window functions and want to learn more, you can refer to these books:
- SQL Queries for Mere Mortals by John Viescas covers window functions in its very last chapter (Chapter 22, 4th edition 2018). These are the useful features:
- Syntax diagrams, both within the chapter and in Appendix A, which show how to write the window function and how it fits in the broader SQL query.
- A table showing which of the various clauses (PARTITION BY, ORDER BY, ROWS BETWEEN) you need to use for different types of window functions.
- SQL Cookbook by Anthony Molinaro has examples of window functions within the “recipes”, as well as an appendix explaining in-depth how window functions were derived from the mechanics of the GROUP BY clause. This book presents the information in a more technical way, which might be harder for a business user to follow.
Key actions and take-aways:
- The next time you find yourself writing functions in Excel to cover multiple rows of data, consider whether you could use a SQL window function instead.
- Most of the time, your problem will be similar to one of the two examples within this post. When writing the query for the first time, try breaking it up into smaller steps to ensure that the output of any sub-queries that you create look the way you expect before moving on to build the next layer of analysis.