Most of you will use Excel to manipulate and plot the data you pull with SQL. Eventually, you’re likely to create charts for presentations to your management. If you sort your data with “ORDER BY” when you pull it in SQL, you’ll save time. As a result, you can skip the “Sort and Filter” step when you create charts with your data in Excel.
This Kaggle notebook contains all the code you need to follow along with the examples. Run cells 1 and 2, then go straight to cells 20-23 (Chapter 7).
Sort data with ORDER BY on numerical values
Let’s return to the openaq data set in Google BigQuery. This table lists out the air quality for cities in 98 countries. Within the table, the “value” column contains the numerical value for the air quality. Therefore, we can find the most-polluting cities, as long as we keep the air quality unit consistent.
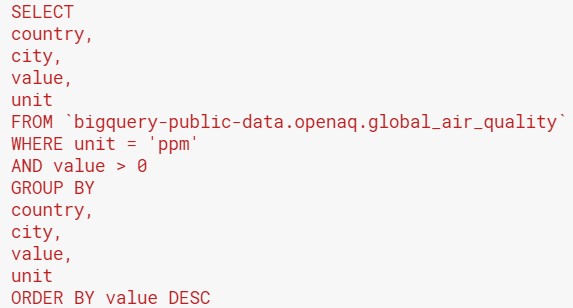
This is a query where I pulled the air quality data by city for all countries measuring air pollution with ‘ppm’. By using “ORDER BY” to rank the values in descending order, I can find the most polluting cities:
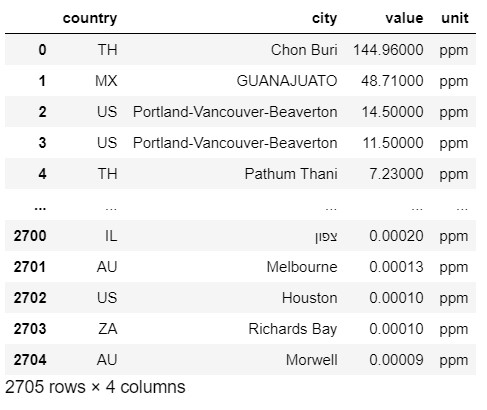
The results of the query are below: you can see that the cities are sorted by descending ppm value. When using “ORDER BY”, you must specify “DESC” to sort on descending values. Usually in business, we want the top performers on any measure, so remembering “DESC” is important! Otherwise, SQL will sort a value in ascending order by default.
Sorting your data with “ORDER BY” on text
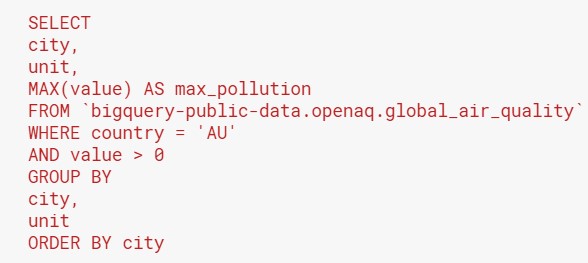
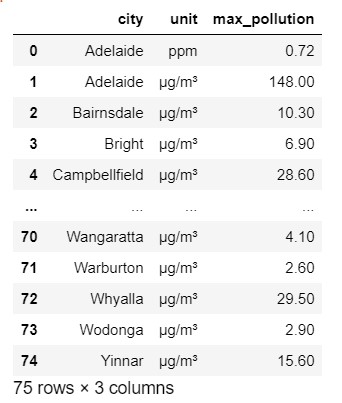
You can also use “ORDER BY” to sort text data alphabetically. Let’s see how this works on the Openaq data set. Suppose we pull all the cities in Australia and sort them in alphabetical order:
The results look like this:
Sorting data on calculated values: Using subqueries
Sometimes, you will want to sort your data on a calculated value. Remember that a calculated value does not exist in the original table. Instead, you created it using operators or functions to manipulate a column in the table.
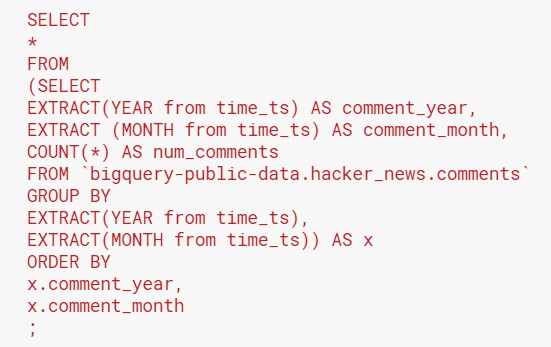
For instance, the Hacker News table records the time of a comment in the time_ts column. However, we will have too many rows if we count comments by every timestamp. Hence, we pulled the year and month of the comment using date functions. But SQL is not smart enough to compute the year and month, and then sort the data in the same query.
Therefore, we have to help SQL break this task down by pulling the year, month and number of comments into a table, which we will call x. Subsequently, we can select all the data from x, sorting it by the year and then the month. Since we didn’t use the DESC keyword, SQL will sort the year, and then months in the same year, in ascending order. For time-based data, an ascending sort usually makes sense because you will plot the metrics in chronological time order. The query looks like this:
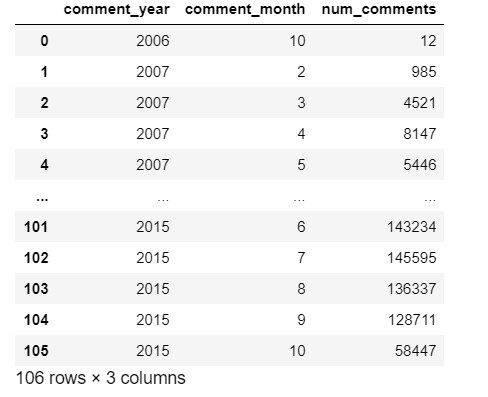
These are the results from the above query. Imagine yourself plotting the number of comments by year and month in Excel using the output. With the time measures pre-sorted in your SQL output, you can simply copy and paste the output into a .csv file and create charts.
Syntax for ORDER BY in relation to other parts of the query
You have probably noticed that in all the examples, the ORDER BY clause is at the end of the query. Actually, SQL is a “black box” in the sequence that it evaluates your code; different versions will adopt different logic. However, it makes it easier for us to remember by thinking of it this way: SQL has to pull all the data before it begins sorting, so ORDER BY has to be at the end.
For easy reference, remember this sequence: SELECT – FROM – WHERE – GROUP BY – HAVING – ORDER BY – LIMIT. In business reporting, you will find WHERE much more useful than HAVING, so I won’t drill into detail about HAVING here. Just think of it as akin to the “WHERE” clause, except that you are filtering on an aggregated value, not on the original tables.
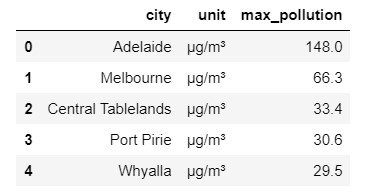
LIMIT is more useful, because you’ll often need to pull top performers for a particular measure. By using LIMIT, you can set the number of rows that SQL brings back. As such, you can combine ORDER BY and LIMIT to get top performers. For example, let’s pull the top 5 most polluting cities in Australia from the Openaq data set:
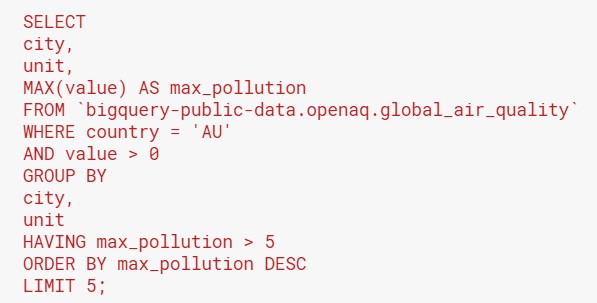
You will get the following results:
- For every column in your output that you’ve created with an aggregation function, you will have an alias.
- You can use this alias to refer to that calculated column in the HAVING and ORDER BY clauses. By this time, SQL has already calculated the column and knows the name that you assigned to it.
Key actions and take-aways:
- When you next pull data from SQL for a presentation, try to do as much of your sorting in SQL using ORDER BY. This will save you time when working in Excel.
- The next time you need to answer a “top X performers” type of question, try using ORDER BY and LIMIT to pull the answer directly out of SQL. Does this save you time vs. sorting and cutting off the data in Excel?